
Weather 101: Analog Forecasting
The art of winter forecasting, to say the least, is a complicated one.
Winter is by far the most volatile season of the year, thanks to a strengthened, more unpredictable jet stream. This narrow path of high winds aloft can control where strong storms and large temperature swings form, leading to its patterns being closely examined.
One tactic meteorologists use is analog forecasting, or looking at how current conditions compare to past, similar weather patterns. These conditions span all across the world, including in the Atlantic, Pacific, and Indian Oceans. Essentially, meteorologists determine years that most closely align with the current setup and compare how winters have played out.
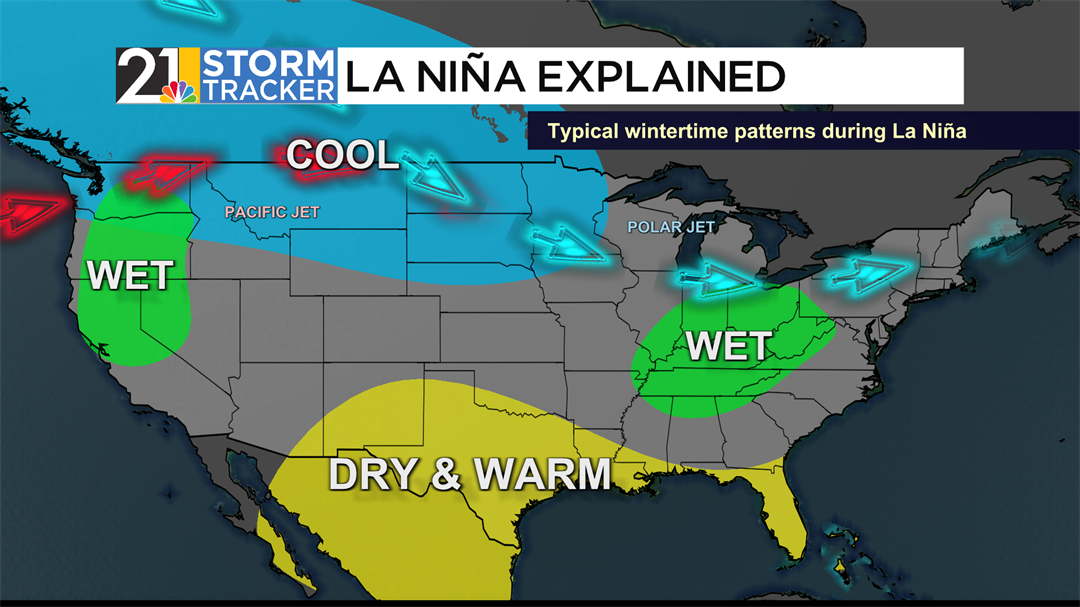
The most well-known phenomenon is ENSO, short for the El Niño Southern Oscillation. Between its two phases, El Niño and La Niña, Earth is currently in a La Niña. This occurs when waters off South America cool below average due to stronger-than-usual trade winds (Learn more about ENSO here). La Niñas move the polar jet stream south, allowing the northern tier of the country to get colder than average. Its position closer to the Valley allows our winters to be wetter than average, though with no big impact on our temperatures.
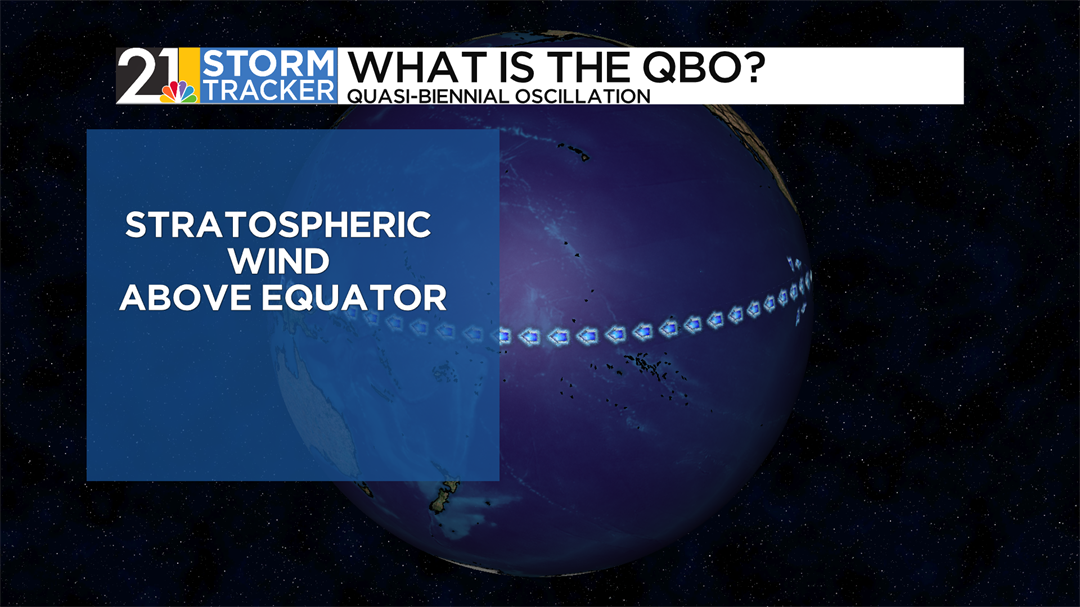
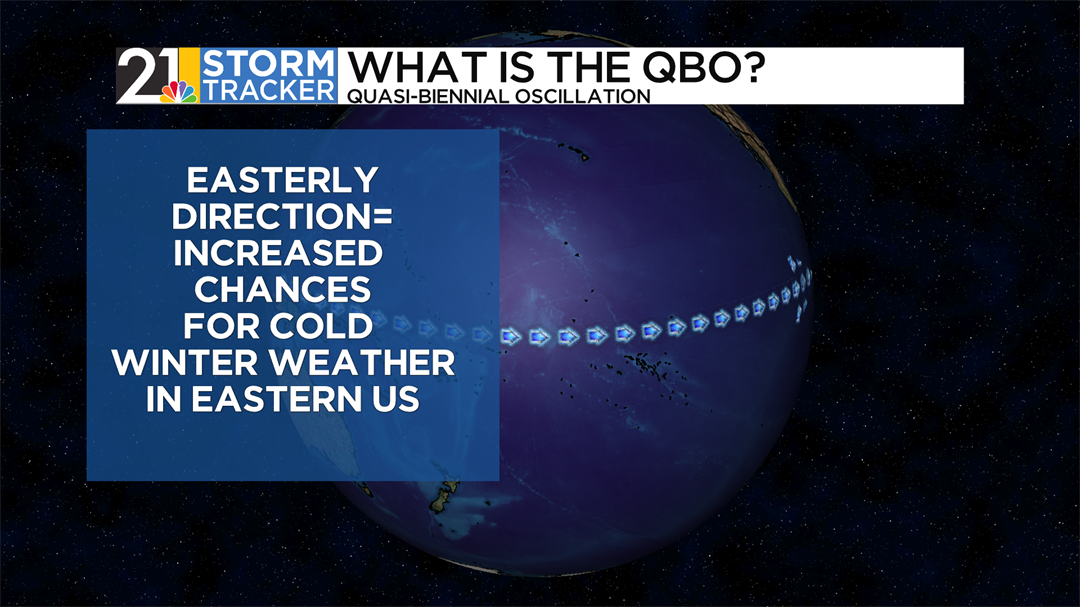
Some analogs allow us to go high up in the atmosphere. The QBO, or the Quasi-Biennial Oscillation, is the change in stratospheric wind movement- simply how the wind moves between 10 and 30 miles above us, at the equator. The wind direction cycles between moving West and East every year or so. If winds were moving west during our winters, this has been shown to make the weather a bit milder in our region. East-moving winds increase our chance for colder winter weather. Currently, the QBO is in a very strong easterly phase, which suggests that very chilly weather is possible, especially if the phase stays put throughout the winter. While suggesting significant chill, there is no direct link to precipitation departures.
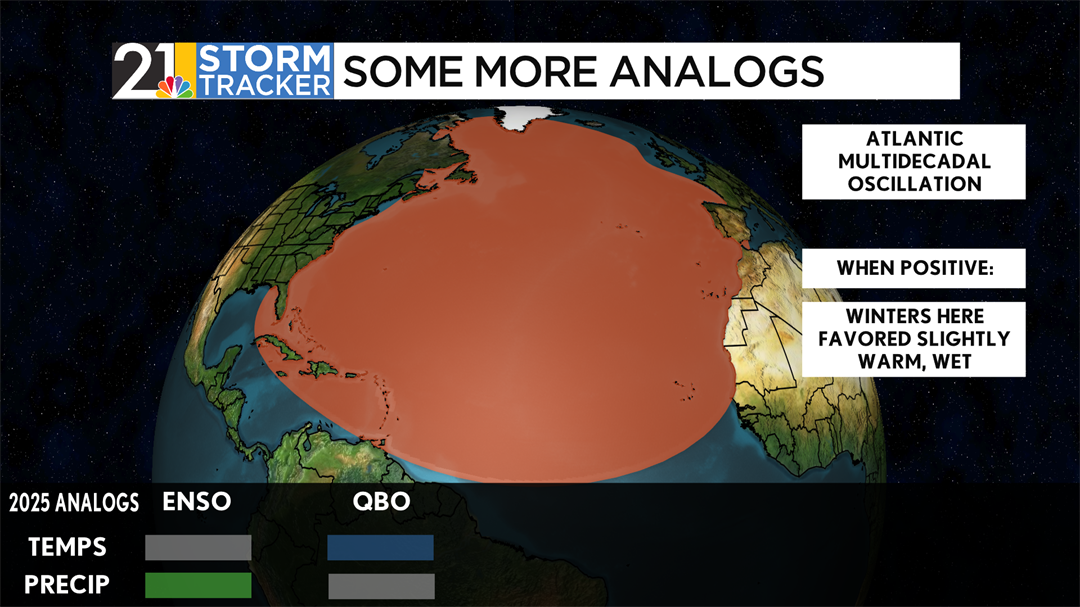
Several other analogs examined are based on sea surface temperatures and their behavior. The Atlantic Multidecadal Oscillation, or AMO, is a cyclic change of Atlantic waters over the course of many years, hence the name. This analog inspects the entire North Atlantic Ocean and its temperature departure. The AMO has been positive for the last five years, and with only brief interruptions since 2000. Within the Valley, winters are favored to be slightly warmer and wetter, compared to a negative AMO, where winters are still warm, though without too much confidence in terms of precipitation.
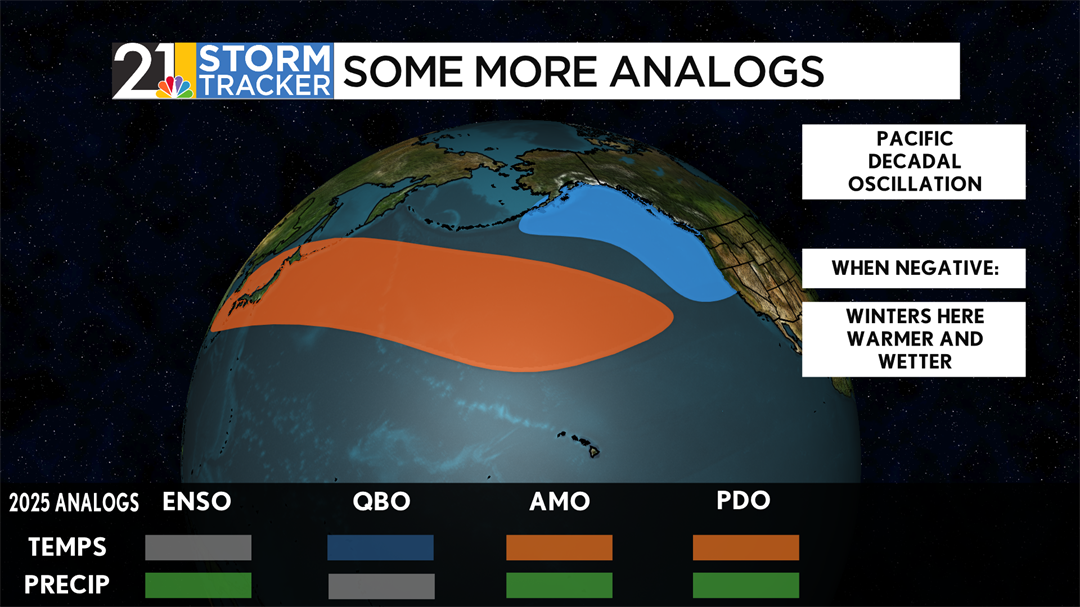
A similar story is told in the Pacific Ocean, where the Pacific Decadal Oscillation is measured. The PDO similarly tracks sea surface temperature departure in positive and negative phases, though the departure within the ocean is not uniform, as would be the AMO. In its positive phase, SSTs off the Pacific Coasts of the U.S. and Canada would be higher than average, while temperatures off the coasts of Japan, the Korean Peninsula, and Russia would be lower than average. This setup favors cold and dry conditions across our area during the winter. However, the PDO is in a strong negative phase this year, and has been since 2018. There are warmer sea surface temperature departures off the Asian coast, while colder ones are protruding off the North American coast. In years past, winters here in this setup have trended warmer and wetter than average.
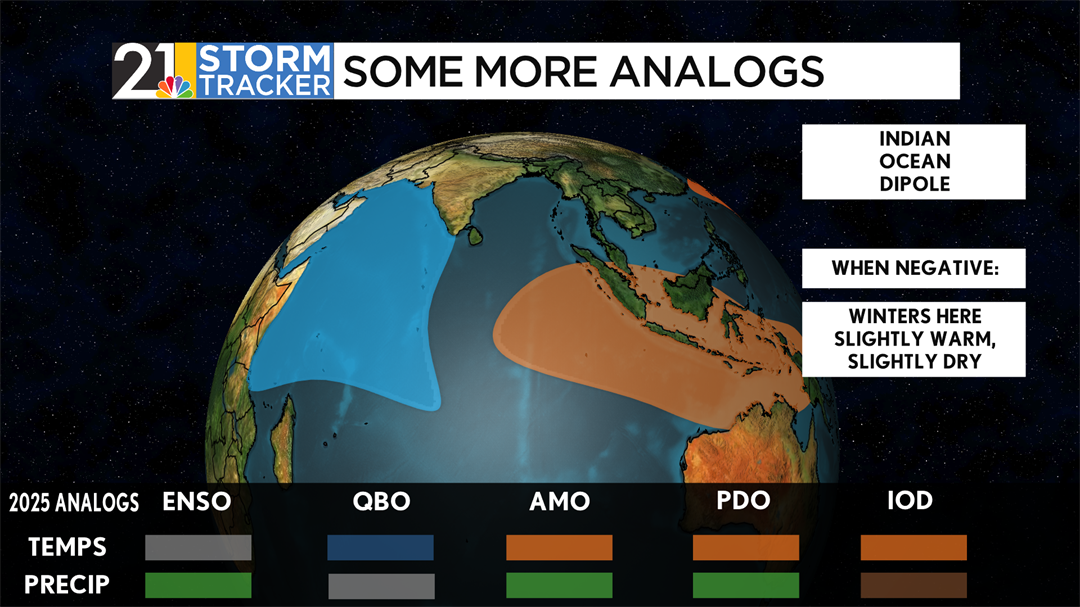
A similar setup exists in the Indian Ocean, where the IOD is tracked. The Indian Ocean Dipole, when in its positive phase, means there are high sea surface temperature departures off the coast of Africa, while negative departures exist closer to Australia and the Southern Asian Islands. In this stage, Valley winters haven’t seen a big hit in either direction from either variable. Much like the PDO, the IOD is negative. Looking back, winter temperatures around here have been slightly warmer and drier than average.
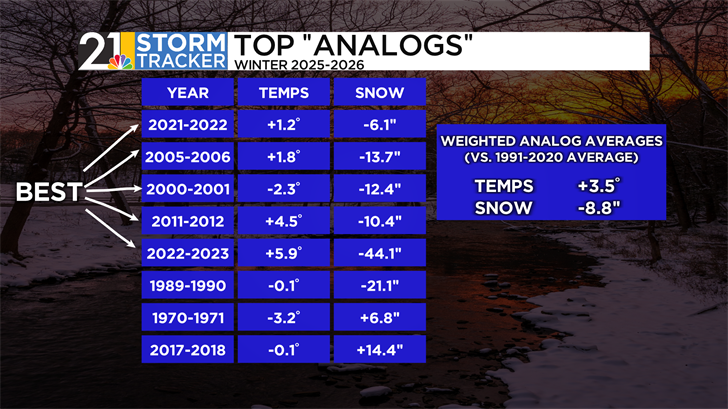
After compiling the status of these five analogs, plus even more, meteorologists put this data together and compare similar winters. In the past 50 years, the winters of 2021-22, 2005-06, 2000-01, 2011-12, and 2022-23 have been the most similar, with all but one showing both temperatures and snowfall have finished above and below average, respectively. Other years, such as 2017-18, show conflicting results, though the weighted average between the most similar years predicts that temperatures will finish above average, while snow will again lag.
Remember, analog forecasting is one of several ways to piece together the complicated puzzle of predicting winter. Chief meteorologist Eric Wilhelm goes through his prediction of this coming winter in his newly released winter forecast here.
